Difference between revisions of "Online Monitoring"
| Line 10: | Line 10: | ||
== Dead Time: '''datamon''' == | == Dead Time: '''datamon''' == | ||
| + | [[file:datamon_screen.jpg|right|300px|]] | ||
| + | There is a display to monitor the DAQ dead time. To run it use the idaq user on opsmdaq0. Type: '''datamon''' | ||
| − | |||
| − | |||
== Scaler Data written to EPICS == | == Scaler Data written to EPICS == | ||
Revision as of 12:38, 28 October 2013
Online Monitoring
Scalers: xscaler
"xscaler" is a graphical display of the scalers from the Mott DAQ.
Login to opsmdaq0 as the "idaq" user (ssh idaq@opsmdaq0). To run xscaler you must be in the correct directory. Go to /opt/idaq/xscaler and type ./xscaler there and do not forget the dot (.) and slash (/)
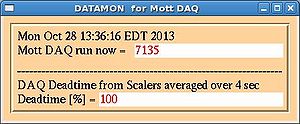
Dead Time: datamon
There is a display to monitor the DAQ dead time. To run it use the idaq user on opsmdaq0. Type: datamon
Scaler Data written to EPICS
The scaler data which appears in xscaler (see above for xscaler) is also written to EPICS. The data are rates in Hz.
The EPICS channels are of the form "Inj_ScalerN_ChM" where N = 1,2,3 and M = 1,2,3,4,...32. See xscaler for channels assignments. Also listed here:
To retrieve data from EPICS you can, for example, do this:
caget Inj_Scaler1_Ch24
Inj_Scaler1_Ch24 484195
The number here means 484195 Hz.
Online Histogram Display
Log on opsmdaq0 using idaq user and from the idaq home directory and type: peppoOnline.
Two windows open, the smaller one have buttons to control the plot to see, the biggest one shows the plot to monitor.
