Difference between revisions of "Online Monitoring"
| Line 56: | Line 56: | ||
After starting a CODA run, log on opsmdaq0 using idaq user and from the idaq home directory and type: '''MottOnline'''. | After starting a CODA run, log on opsmdaq0 using idaq user and from the idaq home directory and type: '''MottOnline'''. | ||
| − | The source files are in: ''' | + | The source files are in: '''~idaq/online''' |
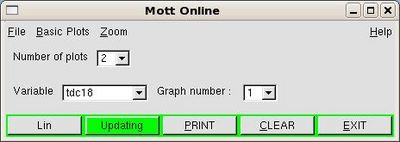
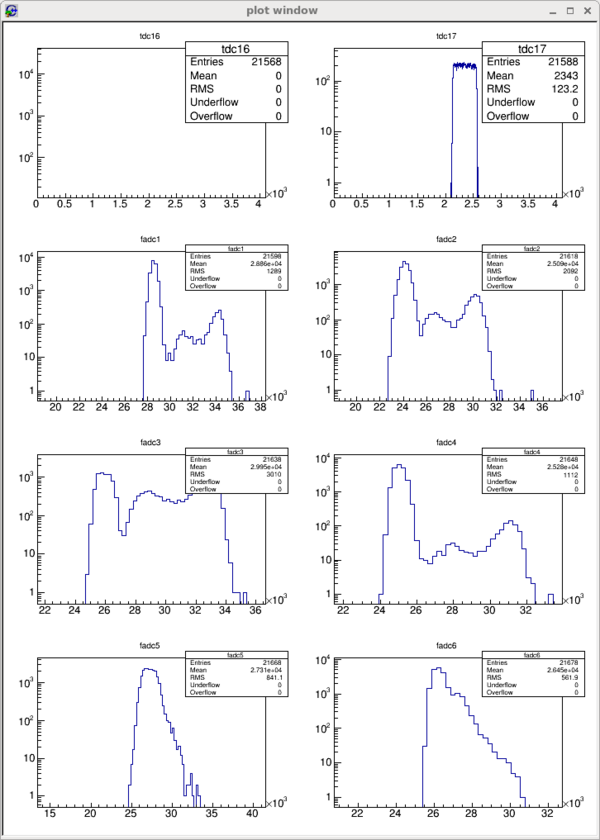
Two windows open, the smaller one have buttons to control the plot to see, the biggest one shows the plot to monitor. | Two windows open, the smaller one have buttons to control the plot to see, the biggest one shows the plot to monitor. | ||
Latest revision as of 09:37, 16 June 2016
Scalers: xscaler
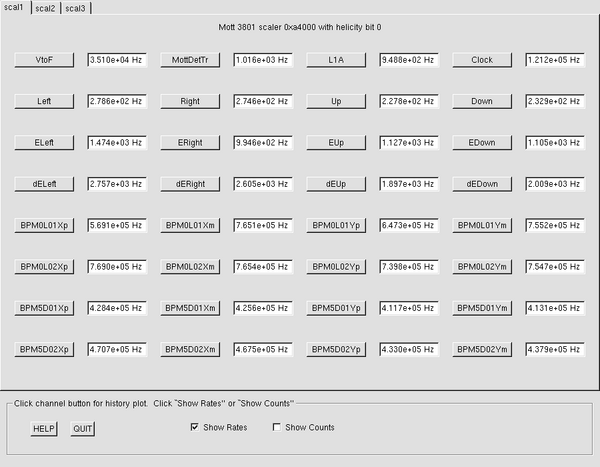
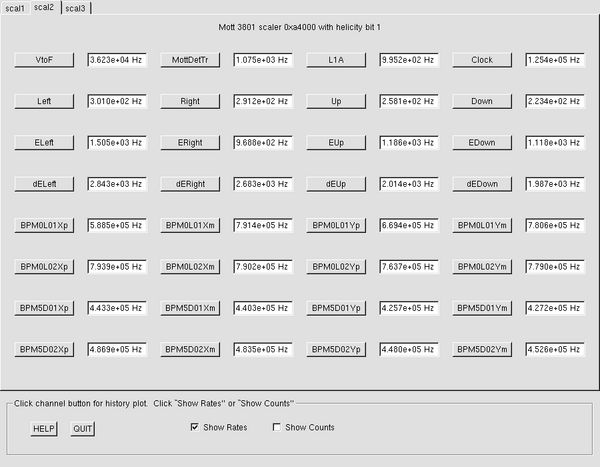
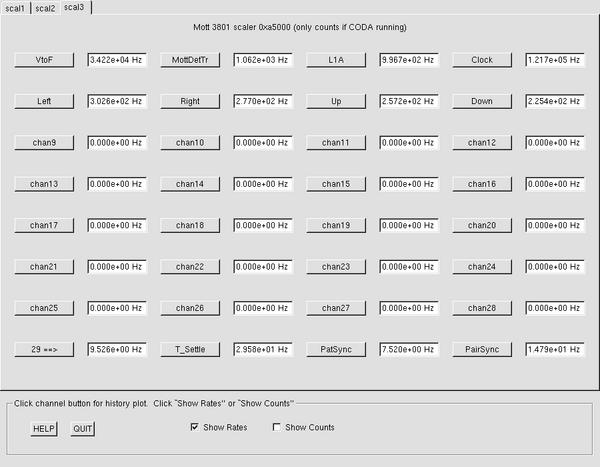
"xscaler" is a graphical display of the scalers from the Mott DAQ.
Login to opsmdaq0 as the "idaq" user (ssh idaq@opsmdaq0). To run xscaler you must be in the correct directory. Go to /opt/idaq/xscaler and type ./xscaler there and do not forget the dot (.) and slash (/)
To re-compile xscaler: follow instructions in /opt/idaq/xscaler/COMPILE
     cd ./devel/hana_decode ; make clean ; make libdc.a
     cd ./devel/hana_scaler ; make clean ; cp ../hana_decode/libdc.a libdc_local.a ; make xscaler
     cp xscaler ../..
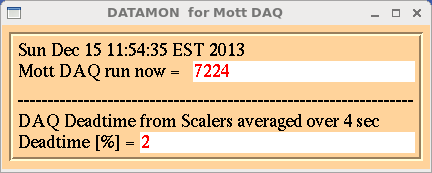
Dead Time: datamon
There is a display to monitor the DAQ dead time. To run it use the idaq user on opsmdaq0. Type: datamon
Scaler Data written to EPICS
The scaler data which appears in xscaler (see above for xscaler) is also written to EPICS and archived. The data are rates in Hz.
idaq@opsmdaq0 > /opt/idaq/scaler/scaser/startScalEpics starts Scaler-to-Epics script if not already running.
The EPICS channels are of the form "Inj_ScalerN_ChM" where N = 1,2,3 and M = 1,2,3,4,...32. See xscaler for channels assignments. Also listed here:
To retrieve data from EPICS you can, for example, do this:
caget Inj_Scaler1_Ch24
Inj_Scaler1_Ch24 484195
The number here means 484195 Hz.
A softIOC named iocsoftmdaq was created that now holds EPICS records that used to live on the PIOC. Also a record named MottRunNumber was added.
Online Histogram Display (While CODA is running)
After starting a CODA run, log on opsmdaq0 using idaq user and from the idaq home directory and type: MottOnline. The source files are in: ~idaq/online
Two windows open, the smaller one have buttons to control the plot to see, the biggest one shows the plot to monitor.
