Online Monitoring
Scalers: xscaler
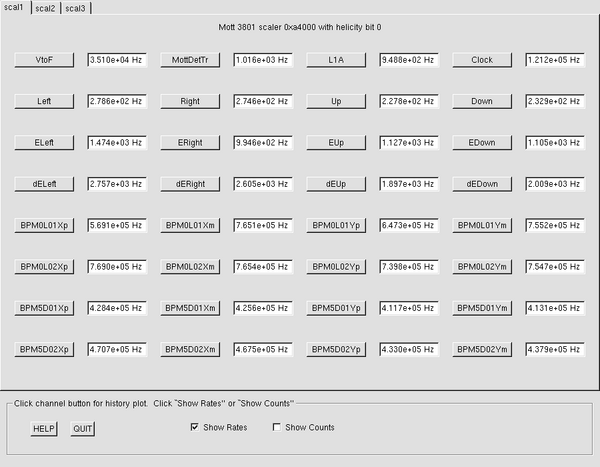
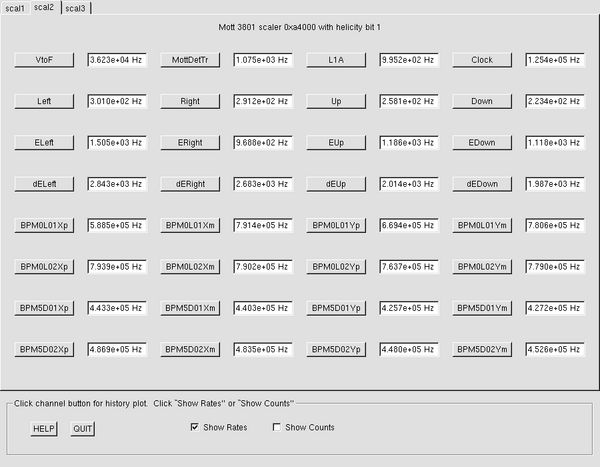
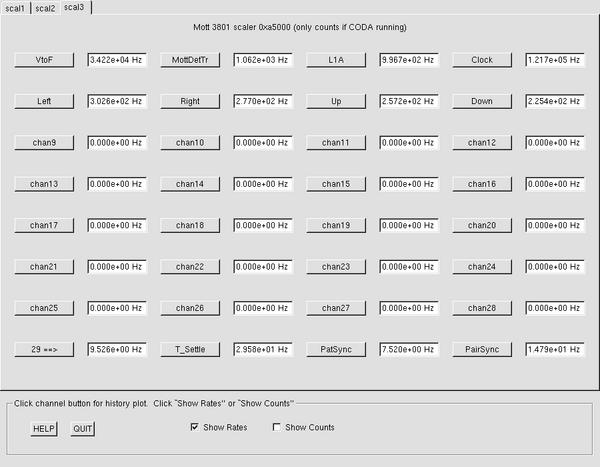
"xscaler" is a graphical display of the scalers from the Mott DAQ.
Login to opsmdaq0 as the "idaq" user (ssh idaq@opsmdaq0). To run xscaler you must be in the correct directory. Go to /opt/idaq/xscaler and type ./xscaler there and do not forget the dot (.) and slash (/)
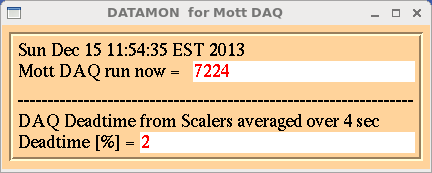
Dead Time: datamon
There is a display to monitor the DAQ dead time. To run it use the idaq user on opsmdaq0. Type: datamon
Scaler Data written to EPICS
The scaler data which appears in xscaler (see above for xscaler) is also written to EPICS and archived. The data are rates in Hz.
/opt/idaq/scaler/scaser/startScalEpics starts Scaler-to-Epics script if not already running.
The EPICS channels are of the form "Inj_ScalerN_ChM" where N = 1,2,3 and M = 1,2,3,4,...32. See xscaler for channels assignments. Also listed here:
To retrieve data from EPICS you can, for example, do this:
caget Inj_Scaler1_Ch24
Inj_Scaler1_Ch24 484195
The number here means 484195 Hz.
A softIOC named iocsoftmdaq was created that now holds EPICS records that used to live on the PIOC. Also a record named MottRunNumber was added.
Online Histogram Display (While CODA is running)
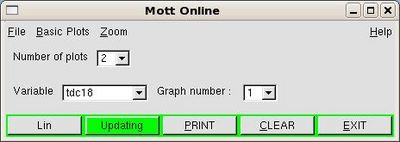
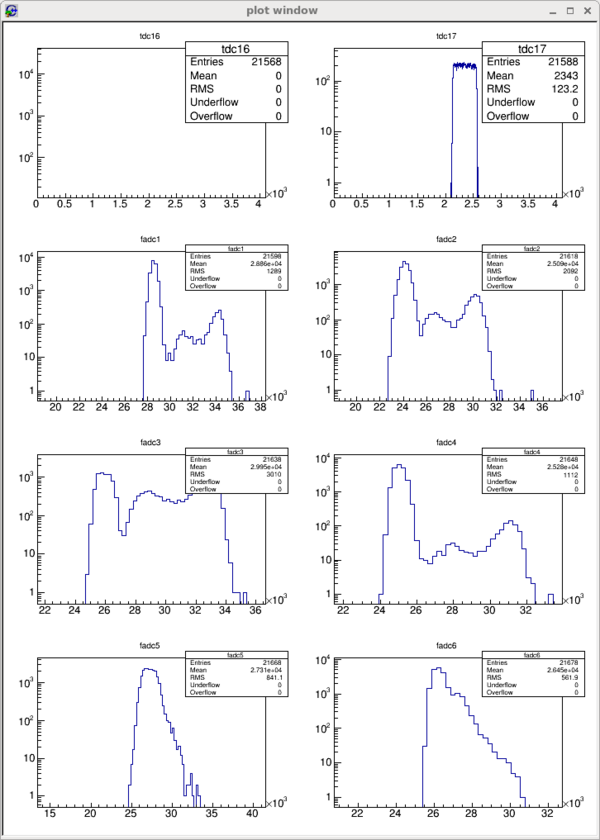
After starting a CODA run, log on opsmdaq0 using idaq user and from the idaq home directory and type: MottOnline. The source files are in: /a/itsuser/idaq/online
Two windows open, the smaller one have buttons to control the plot to see, the biggest one shows the plot to monitor.
