Difference between revisions of "EJFAT UDP Single Thread Packet Sending and Receiving"
| Line 1: | Line 1: | ||
| − | = Transmission between ejfat-2 and | + | = Transmission between sender on ejfat-2 and the LB on ejfat-1 and from there to receiver on ejfat-1(Sep 2022) = |
| − | <font size="+1">Here we test the data rate between a single threaded UDP sender and a single threaded receiver. | + | <font size="+1">Here we test the data rate between a single threaded UDP sender and a single threaded receiver. Data was sent from ejfat-2 to LB on ejfat-1 (172.19.22.241), using</font> |
| − | |||
| − | Data was sent from ejfat-2 to LB on ejfat-1 (172.19.22.241), using</font> | ||
<pre> | <pre> | ||
./packetBlaster -p 19522 -host 172.19.22.241 -mtu 9000 -s 25000000 -b 100000 -cores 80 | ./packetBlaster -p 19522 -host 172.19.22.241 -mtu 9000 -s 25000000 -b 100000 -cores 80 | ||
</pre> | </pre> | ||
| − | in which the UDP Send buffer = 50MB and the app sent buffers of 100kB. The | + | <font size="+1">in which the UDP Send buffer = 50MB and the app sent buffers of 100kB. The receiver was run as:</font> |
| − | + | <pre> | |
| − | + | ./packetBlastee -p 17750 -b 400000 -r 25000000 -cores 80 | |
| − | + | </pre> | |
| − | |||
| − | < | ||
| − | |||
| − | |||
| − | |||
| − | |||
| − | |||
| − | |||
| − | + | <font size="+1">The sending and receiving threads were pinned to core #80. This is because cores 80-87 are on the same NUMA node as the NIC and perform by far the best when transferring data. When the same test was run pinning the threads to core #1 (on worst performing node) the max transfer rate was 1000 MB/s. After that packets were constantly being dropped.</font> | |
| − | <font size="+1"> | ||
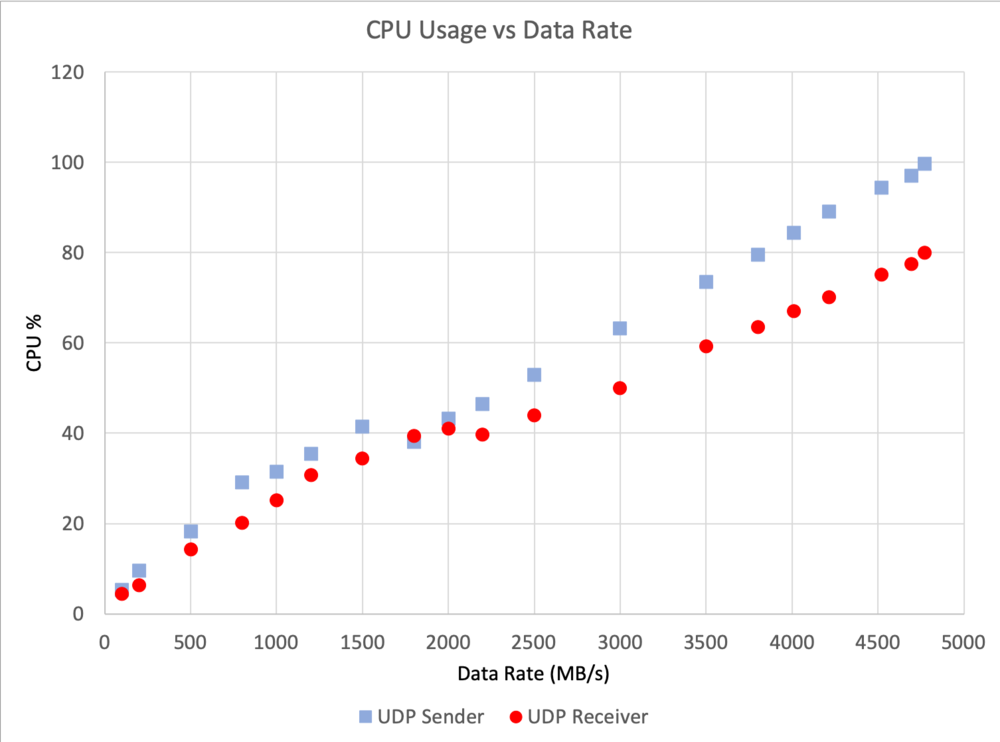
| − | <font size="+1">The following | + | <font size="+1">The following graph shows the CPU usage of both sender and receiver as a function of the data rate.</font> |
Revision as of 16:09, 12 September 2022
Transmission between sender on ejfat-2 and the LB on ejfat-1 and from there to receiver on ejfat-1(Sep 2022)
Here we test the data rate between a single threaded UDP sender and a single threaded receiver. Data was sent from ejfat-2 to LB on ejfat-1 (172.19.22.241), using
./packetBlaster -p 19522 -host 172.19.22.241 -mtu 9000 -s 25000000 -b 100000 -cores 80
in which the UDP Send buffer = 50MB and the app sent buffers of 100kB. The receiver was run as:
./packetBlastee -p 17750 -b 400000 -r 25000000 -cores 80
The sending and receiving threads were pinned to core #80. This is because cores 80-87 are on the same NUMA node as the NIC and perform by far the best when transferring data. When the same test was run pinning the threads to core #1 (on worst performing node) the max transfer rate was 1000 MB/s. After that packets were constantly being dropped.
The following graph shows the CPU usage of both sender and receiver as a function of the data rate.

Conclusions
Notice how the data rate spikes when the core used to send is in the same NUMA node as the NIC itself. In addition, the faster rates always corresponded to the closer NUMA node. Setting the sender's core to get the best performance is a necessity as running the program without specifying it defaults to a low core # such as 8 or 10. The core must be specified to be in the range 80-87 in order to get the best performance. Note that running in realtime RR scheduling made the program considerably slower and uneven in performance. It would not run in the realtime FIFO mode at all.