Deploy Prometheus Monitoring with Prometheus Operator
Jump to navigation
Jump to search
Deploy Prometheus Monitoring with Prometheus Operator
This guide outlines the deployment process for a custom Prometheus monitoring setup using the Prometheus Operator.
Prerequisites
Ensure your Kubernetes cluster has:
Deployment Flow Chart
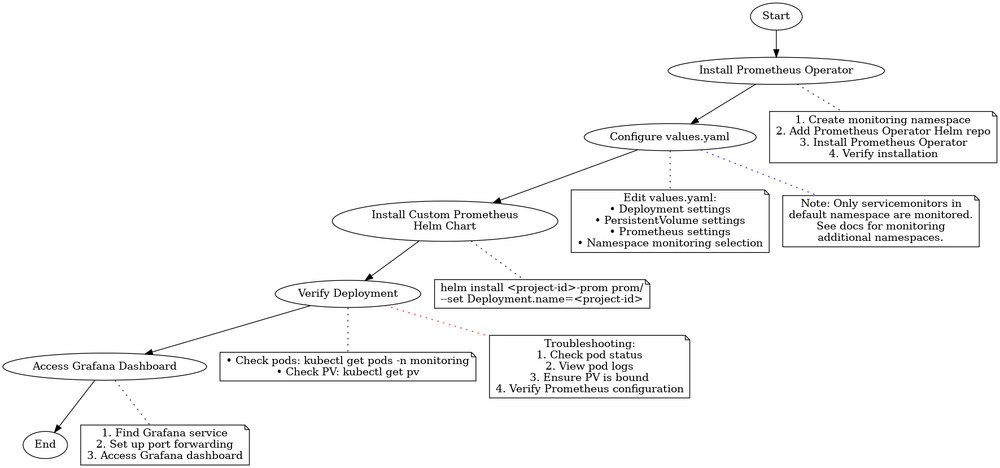
Below is a visual representation of the Prometheus deployment process:
This flow chart illustrates the key steps in deploying Prometheus monitoring using the Prometheus Operator.
Deployment Steps
- Install Prometheus Operator: First, we need to install the Prometheus Operator:
- Create a namespace for monitoring:
kubectl create namespace monitoring
- Add the Prometheus Operator Helm repository:
   helm repo add prometheus-community https://prometheus-community.github.io/helm-charts
   helm repo update
- Install the Prometheus Operator:
helm install prometheus-operator prometheus-community/kube-prometheus-stack -n monitoring
- Verify the installation:
kubectl get pods -n monitoring
- Configure Values: Edit `values.yaml` to set your specific configuration:
   Deployment:
     name: <project-id>
     namespace: default

   PersistentVolume:
     node: jiriaf2302-control-plane
     path: /var/prom
     size: 5Gi

   Prometheus:
     serviceaccount: prometheus-k8s
     namespace: monitoring
  Key configurations:
  * `Deployment.name`: Used for job naming, persistent volume path, and service monitoring selection
  * `Deployment.namespace`: Specifies job namespace and namespace monitoring selection
  * `PersistentVolume.*`: Configures storage for Prometheus data
  * `Prometheus.*`: Sets Prometheus server details
Note: Only those `servicemonitors` with the namespace `default` can be monitored. To monitor additional namespaces, additional configuration is required. Refer to the Prometheus Operator documentation on customizations for details.
- Install the Custom Prometheus Helm Chart: Run the following command, replacing `<project-id>` with your identifier:
helm install <project-id>-prom prom/ --set Deployment.name=<project-id>
Example:
   ID=jlab-100g-nersc-ornl
   helm install $ID-prom prom/ --set Deployment.name=$ID
- Verify Deployment: Check that all components are running:
   kubectl get pods -n monitoring
   kubectl get pv
- Access Grafana Dashboard:
- Find the Grafana service:
kubectl get svc -n monitoring
- Set up port forwarding:
kubectl port-forward svc/prometheus-operator-grafana -n monitoring 3000:80
- Access Grafana at `http://localhost:3000` (default credentials: admin/admin)
Components Deployed
- Prometheus Server (`prometheus.yaml`)
- Persistent Volume for data storage (`prom-pv.yaml`)
- Empty directory creation job (`prom-create_emptydir.yaml`)
Integration with Workflows
This setup is designed to monitor services and jobs created by your workflow system.
Advanced Configuration
For further customization, refer to the Helm chart templates and `values.yaml`. Ensure your cluster has the necessary permissions and resources for persistent volumes and Prometheus server operation.
Troubleshooting
If you encounter issues:
- Check pod status: `kubectl get pods -n monitoring`
- View pod logs: `kubectl logs <pod-name> -n monitoring`
- Ensure persistent volume is correctly bound: `kubectl get pv`
- Verify Prometheus configuration: `kubectl get prometheus -n monitoring -o yaml`
For more help, consult the Prometheus Operator documentation.
