Deploy Prometheus Monitoring with Prometheus Operator
Deploy Prometheus Monitoring with Prometheus Operator
This guide outlines the deployment process for a custom Prometheus monitoring setup using the Prometheus Operator.
Prerequisites
Ensure your Kubernetes cluster has:
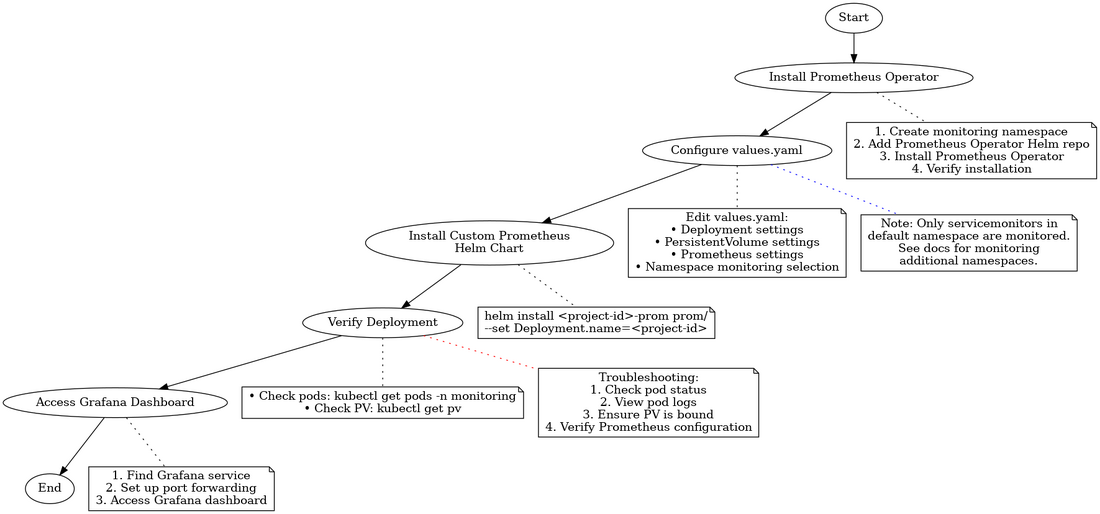
Deployment Flow Chart
Below is a visual representation of the Prometheus deployment process:
This flow chart illustrates the key steps in deploying Prometheus monitoring using the Prometheus Operator.
Deployment Steps
1. Setup Environment
Clone the repository and navigate to the prom folder:
git clone https://github.com/JeffersonLab/jiriaf-test-platform.git
cd jiriaf-test-platform/main/prom
2. Install Prometheus Operator
Instead of using Helm, we'll use the community-maintained manifests from the kube-prometheus project:
a. Clone the kube-prometheus repository:
git clone --depth 1 https://github.com/prometheus-operator/kube-prometheus.git /tmp/kube-prometheus
b. Copy the manifests to your current directory:
cp -R /tmp/kube-prometheus/manifests .
c. Create the Custom Resource Definitions (CRDs) and Prometheus Operator:
kubectl create -f ./manifests/setup/
d. Apply the remaining manifests:
kubectl create -f ./manifests/
e. Verify the installation:
kubectl -n monitoring get pods
3. Configure Values
Edit values.yaml to set your specific configuration:
Deployment:
  name: <project-id>
  namespace: default

PersistentVolume:
  node: jiriaf2302-control-plane
  path: /var/prom
  size: 5Gi

Prometheus:
  serviceaccount: prometheus-k8s
  namespace: monitoring
Key configurations:
Deployment.name: Used for job naming, persistent volume path, and service monitoring selectionDeployment.namespace: Specifies job namespace and namespace monitoring selectionPersistentVolume.*: Configures storage for Prometheus dataPrometheus.*: Sets Prometheus server details
Note: Only those servicemonitors with the namespace default can be monitored. To monitor additional namespaces, additional configuration is required. Refer to the Prometheus Operator documentation on customizations for details.
4. Install the Custom Prometheus Helm Chart
Run the following command, replacing <project-id> with your identifier:
helm install <project-id>-prom prom/ --set Deployment.name=<project-id>
Example:
ID=jlab-100g-nersc-ornl
helm install $ID-prom prom/ --set Deployment.name=$ID
5. Verify Deployment
Check that all components are running:
kubectl get pods -n monitoring
kubectl get pv
6. Access Grafana Dashboard
a. Find the Grafana service:
kubectl get svc -n monitoring
b. Set up port forwarding:
kubectl port-forward svc/prometheus-operator-grafana -n monitoring 3000:80
c. Access Grafana at http://localhost:3000 (default credentials: admin/admin or admin/prom-operator)
Components Deployed
- Prometheus Server (
prometheus.yaml) - Persistent Volume for data storage (
prom-pv.yaml) - Empty directory creation job (
prom-create_emptydir.yaml)
Integration with Workflows
This setup is designed to monitor services and jobs created by your workflow system.
Advanced Configuration
For further customization, refer to the Helm chart templates and values.yaml. Ensure your cluster has the necessary permissions and resources for persistent volumes and Prometheus server operation.
Troubleshooting
If you encounter issues:
- Check pod status:
kubectl get pods -n monitoring - View pod logs:
kubectl logs <pod-name> -n monitoring - Ensure persistent volume is correctly bound:
kubectl get pv - Verify Prometheus configuration:
kubectl get prometheus -n monitoring -o yaml
