Difference between revisions of "Run Group M"
| Line 282: | Line 282: | ||
'''Regularly''': | '''Regularly''': | ||
| − | |||
| − | |||
* <font color=red>'''reset & check spectra frequently (every 30 - 60 minutes)'''</font> | * <font color=red>'''reset & check spectra frequently (every 30 - 60 minutes)'''</font> | ||
| Line 289: | Line 287: | ||
*** ECAL (ADC Histograms, FADC Timing, TDC Histograms | *** ECAL (ADC Histograms, FADC Timing, TDC Histograms | ||
*** FTOF (ADC Histograms, FADC Timing, TDC Histograms, GMEAN | *** FTOF (ADC Histograms, FADC Timing, TDC Histograms, GMEAN | ||
| + | |||
| + | * Log the '''strip charts''' in time intervals '''according to the x-axis time span''', using the liveplot configuration '''Beamline4Logbook''', see https://logbooks.jlab.org/entry/3978837 . | ||
| + | ** in VNC: use CS-Studio, Tools, Strip Charts, livePlot | ||
| + | *** right-click on the livePlot screen and select "Load a Configuration" | ||
| + | *** the configuration "Beamline4Logbook" provides the beam current and position information | ||
| + | *** right-click on the screen and select "Make Elog Entry", make sure to log to HBLOG and not ELOG | ||
| + | |||
| + | * in Web Browser: [https://epicsweb.jlab.org/wave/?myaDeployment=ops&myaLimit=100000&windowMinutes=30&title=Upstream+and+Midstream+Halo+Counters&fullscreen=false&layoutMode=2&viewerMode=2&pv=scaler_cS3b&pv=scaler_cS4b&pv=scaler_cS6b&pv=scaler_cS12b&pv=scaler_cS13b&pv=scaler_cS14b&pv=scaler_cS15b&scaler_cS3blabel=scaler_cS3b&scaler_cS3bcolor=%23a6cee3&scaler_cS3byAxisLabel=Rate++%28Hz%29&scaler_cS3byAxisMin=&scaler_cS3byAxisMax=&scaler_cS3byAxisLog&scaler_cS3bscaler=&start=2020-08-08+09%3A02%3A36&end=2020-08-08+09%3A07%3A36&scaler_cS4blabel=scaler_cS4b&scaler_cS4bcolor=%231f78b4&scaler_cS4byAxisLabel=&scaler_cS4byAxisMin=&scaler_cS4byAxisMax=&scaler_cS4byAxisLog=&scaler_cS4bscaler=&scaler_cS5byAxisLabel=&scaler_cS5byAxisMin=&scaler_cS5byAxisMax=&scaler_cS5byAxisLog=&scaler_cS5bscaler=&scaler_cS6blabel=scaler_cS6b&scaler_cS6bcolor=%2333a02c&scaler_cS6byAxisLabel=&scaler_cS6byAxisMin=&scaler_cS6byAxisMax=&scaler_cS6byAxisLog=&scaler_cS6bscaler=&scaler_cS7byAxisLabel=&scaler_cS7byAxisMin=&scaler_cS7byAxisMax=&scaler_cS7byAxisLog=&scaler_cS7bscaler=&scaler_cS12blabel=scaler_cS12b&scaler_cS12bcolor=%23e31a1c&scaler_cS12byAxisLabel=&scaler_cS12byAxisMin=&scaler_cS12byAxisMax=&scaler_cS12byAxisLog=&scaler_cS12bscaler=&scaler_cS13blabel=scaler_cS13b&scaler_cS13bcolor=%23fdbf6f&scaler_cS13byAxisLabel=&scaler_cS13byAxisMin=&scaler_cS13byAxisMax=&scaler_cS13byAxisLog=&scaler_cS13bscaler=&scaler_cS14blabel=scaler_cS14b&scaler_cS14bcolor=%23ff7f00&scaler_cS14byAxisLabel=&scaler_cS14byAxisMin=&scaler_cS14byAxisMax=&scaler_cS14byAxisLog=&scaler_cS14bscaler=&scaler_cS15blabel=scaler_cS15b&scaler_cS15bcolor=%23cab2d6&scaler_cS15byAxisLabel=&scaler_cS15byAxisMin=&scaler_cS15byAxisMax=&scaler_cS15byAxisLog=&scaler_cS15bscaler= Upstream/Midstream Halo Counters], [https://epicsweb.jlab.org/wave/?myaDeployment=ops&myaLimit=100000&windowMinutes=30&title=Downstream+Halo+Counters&fullscreen=false&layoutMode=2&viewerMode=2&pv=scalerS8b&pv=scalerS9b&scalerS8blabel=scalerS8b&scalerS8bcolor=%23a6cee3&scalerS8byAxisLabel=Rate++%28Hz%29&scalerS8byAxisMin=&scalerS8byAxisMax=&scalerS8byAxisLog&scalerS8bscaler=&pv=scalerS10b&pv=scalerS11b&scalerS9blabel=scalerS9b&scalerS9bcolor=%231f78b4&scalerS9byAxisLabel=&scalerS9byAxisMin=&scalerS9byAxisMax=&scalerS9byAxisLog=&scalerS9bscaler=&scalerS10blabel=scalerS10b&scalerS10bcolor=%23b2df8a&scalerS10byAxisLabel=&scalerS10byAxisMin=&scalerS10byAxisMax=&scalerS10byAxisLog=&scalerS10bscaler=&scalerS11blabel=scalerS11b&scalerS11bcolor=%2333a02c&scalerS11byAxisLabel=&scalerS11byAxisMin=&scalerS11byAxisMax=&scalerS11byAxisLog=&scalerS11bscaler= Downstream Halo Counters], [https://epicsweb.jlab.org/wave/?start=2020-07-08+16%3A50%3A02&end=2020-07-08+16%3A55%3A02&myaDeployment=ops&myaLimit=100000&windowMinutes=30&title=Beam+Currents&fullscreen=false&layoutMode=2&viewerMode=2&pv=IPM2C21A&pv=IPM2C24A&pv=scaler_calc1b&IPM2C21Alabel=IPM2C21A&IPM2C21Acolor=%23a6cee3&IPM2C21AyAxisLabel=Beam+Current+%28nA%29&IPM2C21AyAxisMin=0&IPM2C21AyAxisMax=300&IPM2C21AyAxisLog&IPM2C21Ascaler=&scaler_calc1blabel=Faraday+Cup&scaler_calc1bcolor=%23b2df8a&scaler_calc1byAxisLabel=&scaler_calc1byAxisMin=&scaler_calc1byAxisMax=&scaler_calc1byAxisLog&scaler_calc1bscaler= Beam Currents], [https://epicsweb.jlab.org/wave/?start=2020-08-03+12%3A30%3A57&end=2020-08-03+12%3A35%3A57&myaDeployment=ops&myaLimit=100000&windowMinutes=30&title=BPM+Positions+%28Y-Axis+is+mean+%2B%2F-+0.5+mm%29&fullscreen=false&layoutMode=3&viewerMode=2&pv=IPM2C24A.XPOS&pv=IPM2C24A.YPOS&pv=IPM2H01.XPOS&pv=IPM2H01.YPOS&IPM2C24A.XPOSlabel=IPM2C24A.XPOS&IPM2C24A.XPOScolor=%23e31a1c&IPM2C24A.XPOSyAxisLabel=&IPM2C24A.XPOSyAxisMin=-2.0&IPM2C24A.XPOSyAxisMax=+1.0&IPM2C24A.XPOSyAxisLog&IPM2C24A.XPOSscaler=&IPM2C24A.YPOSlabel=IPM2C24A.YPOS&IPM2C24A.YPOScolor=pink&IPM2C24A.YPOSyAxisLabel=&IPM2C24A.YPOSyAxisMin=-2.0&IPM2C24A.YPOSyAxisMax=1.0&IPM2C24A.YPOSyAxisLog&IPM2C24A.YPOSscaler=&IPM2H01.XPOSlabel=IPM2H01.XPOS&IPM2H01.XPOScolor=darkgreen&IPM2H01.XPOSyAxisLabel=&IPM2H01.XPOSyAxisMin=-2.0&IPM2H01.XPOSyAxisMax=1.0&IPM2H01.XPOSyAxisLog&IPM2H01.XPOSscaler=&IPM2H01.YPOSlabel=IPM2H01.YPOS&IPM2H01.YPOScolor=lightgreen&IPM2H01.YPOSyAxisLabel=&IPM2H01.YPOSyAxisMin=-2.0&IPM2H01.YPOSyAxisMax=1.0&IPM2H01.YPOSyAxisLog&IPM2H01.YPOSscaler=#a6cee3&IPM2C24A.XPOSyAxisLabel=2C24+X+(mm)&IPM2C24A.XPOSyAxisMin=-1.5&IPM2C24A.XPOSyAxisMax=-0.5&IPM2C24A.XPOSyAxisLog&IPM2C24A.XPOSscaler=&IPM2C24A.YPOSlabel=IPM2C24A.YPOS&IPM2C24A.YPOScolor=%231f78b4&IPM2C24A.YPOSyAxisLabel=2C24+Y+(mm)&IPM2C24A.YPOSyAxisMin=0.3&IPM2C24A.YPOSyAxisMax=1.3&IPM2C24A.YPOSyAxisLog&IPM2C24A.YPOSscaler=&IPM2H01.XPOSlabel=IPM2H01.XPOS&IPM2H01.XPOScolor=pink&IPM2H01.XPOSyAxisLabel=2H01+X+(mm)&IPM2H01.XPOSyAxisMin=-0.6&IPM2H01.XPOSyAxisMax=0.4&IPM2H01.XPOSyAxisLog&IPM2H01.XPOSscaler=&IPM2H01.YPOSlabel=IPM2H01.YPOS&IPM2H01.YPOScolor=darkred&IPM2H01.YPOSyAxisLabel=2H01+Y+(mm)&IPM2H01.YPOSyAxisMin=0.4&IPM2H01.YPOSyAxisMax=1.4&IPM2H01.YPOSyAxisLog&IPM2H01.YPOSscaler= BPM Positions] | ||
| + | |||
| valign=top | | | valign=top | | ||
Revision as of 11:07, 1 February 2022
- Shift Documentation
- Phone Numbers
- Short Term Schedule
- Notes/Known Issues
- Shift Expert
- Remote Worker Shift
- Monitoring
- Useful Links
Shift ScheduleESAD, COO, RSADShift ChecklistHot CheckoutBeam Time Accounting
|
Manuals |
Procedures |
JLab Logbooks
|
If calling local numbers (with area code prefix 757) from the counting room dial 9+[last 7 digits]. To call other area codes dial 91+[ten digit number]
|
| |||||||||||||||||||||||||||||||||||||||||||||||||||||||||||||||||||||||||||||||||||||||||||||||
- Note, all non-JLab numbers must be dialed with an area code. When calling from a counting-house landline, dial "9" first.
- To call JLab phones from outside the lab, all 4-digit numbers must be preceded by 757-269
- Click Here to edit Phone Numbers. Note, you then also have to edit the current page to force a refresh.
Click Here to edit Phone Numbers. Note, you then also have to edit the current page to force a refresh.
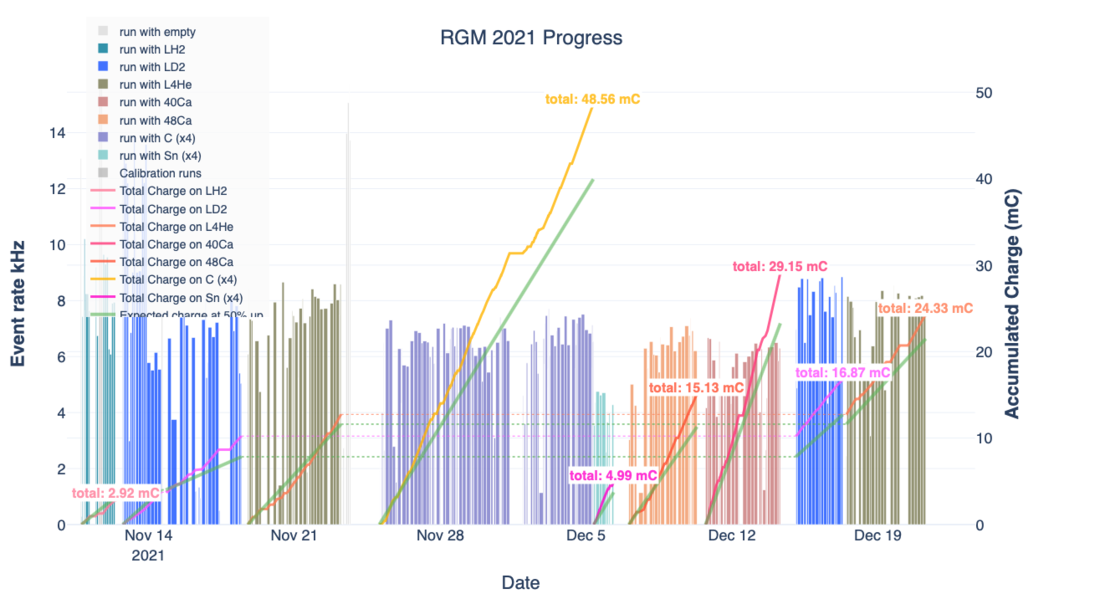
CLAS12 Run Group M, Fall 2021
Beam energies: 2.1, 4.0, 6.0 GeV (1.96 GeV/pass)
RC: Susan Schadmand and Sebastian Kuhn
- Susan Schadmand (757) 575-7540, susansch@jlab.org
- Sebastian Kuhn (757) 639-6640, kuhn@jlab.org
- 9 575 7540 from Counting Room
PDL: Valery Kubarovsky
- (757) 876-1789
- 9 876-1789 from Counting Room
- vpk@jlab.org
Run Plan: Jan 31, 2022
Production runs use PROD67_noVTPread and the trigger rgm_6GeV_inb_v1_0.trg .
Run duration 100M events or 4 hours, whichever comes first.
- status: 6GeV beam, LAr target is full, Beam blocker is OUT
- running: 25nA LAr for 2 days
- next:
- single tin foil for 2 days
- Ca target
DAQ configuration
PROD67_noVTPread , production trigger rgm_6GeV_inb_v1_0.trg .
NOTE: UNLESS a RICH problem crashes the DAQ, do NOT interrupt an otherwise smooth run to do a RICH recovery - instead do this in between runs.
NOTE: BOTH the shift expert AND the shift worker MUST check monitoring histograms at least once every 30-60 minutes to make sure there are no major detector problems.
At the end of each run, follow the STANDARD DAQ RESTART SEQUENCE
- "end run", if the run ended correctly then: "prestart", "go"
- if the run did not end correctly or if any ROCs had to be rebooted:
- "cancel", "reset"
- "configure", "download", "prestart", "go"
- After each step, make sure it is completed in the Run Control message window. If a ROC has crashed, find which one it is, issue a roc_reboot command ON JUST THAT ROC and try again. Contact the DAQ expert if there are any questions.
References and Standards
(last update 01/18/2022- 23:30)
Nominal Beam Positions
- 2H01, X: -0.6 mm, Y: 0.8 mm
- 2C24, X: -2.0 mm, Y: +0.6 mm
FSD Thresholds
- Upstream: 2000 Hz
- Midstream: 2000 Hz
- Downstream: 500000 Hz
- BOM: 10000
- 5 ms dwell time
Reference Harp Scans for Beam on Faraday Cup: 2H01 [1]
Reference Harp Scans for Beam on Tagger dump: 2C21 [2], tagger harp [3]
Reference Monitoring Histograms (6 nA, production C) [4] Old reference Monitoring Histograms (50 nA, production LD2) [5]
Counter rates
- Upstream counters integrated rates: 0-15 Hz (acceptable up to 100 Hz are acceptable) @50 nA.
- Midstream counters: 10-20 Hz (acceptable up to 50 Hz) @50 nA.
- Counting rates of ~ hundreds of Hz may indicate bad beam tune or bleed-through from other Halls.
Beamline vacuum: should be not higher than 5e-5.
NOTE: BOTH the shift expert AND the shift worker MUST check monitoring histograms at least once every 30-60 minutes to make sure there are no major detector problems.
Notes
|
Known Issues
|
|
NOTE: BOTH the shift expert AND the shift worker MUST check monitoring histograms at least once every 30 - 60 minutes to make sure there are no major detector problems.
(remote) shift worker: see dedicated Remote Shifts tab above. |
|
TasksEvery Run:
Every Shift:
Regularly:
|
| ||||||||||||||||||
Webcams
|
Manuals |
Hall Webcams |
Epics on the web
|
Live Monitoring Links
|
|
|
Hall-B
Run lists |
AcceleratorReferences |
ZOOM meetings
|

