Pod IPs
Custom Metrics Monitoring in Kubernetes with Prometheus Operator
In Kubernetes (K8s), monitoring custom metrics is essential for maintaining the health and performance of applications. One popular solution for custom metrics monitoring is the Prometheus Operator. Let's delve into how it works and why it's crucial.
Overview
The Prometheus Operator comprises several key components:
- Services for Listening to Job Pods: These services collect metrics from various pods within the Kubernetes cluster, serving as data sources for Prometheus. Specifically, they listen to the pod IP addresses and the specified ports set in the YAML file. For instance, in a deployment with two duplicates and two metrics:
- Pod 1: IP address "pod_ip1" with ports "port1" and "port2"
- Pod 2: IP address "pod_ip2" with the same ports "port1" and "port2"
This setup ensures that each metric from each duplicate is associated with a unique combination of IP address and port.
- ServiceMonitor: The ServiceMonitor defines which services to monitor and configures Prometheus for scraping metrics from those services. It dynamically generates Prometheus configurations based on the services' labels and selectors.
- Prometheus Instance: This instance consumes the generated configurations and collects metrics from the specified services. It aggregates, stores, and provides query capabilities for these metrics.
The Challenge
Now, let's address a challenge related to pod IP addresses. By default, Kubernetes assigns dynamic IP addresses to pods. However, in our case, the JRM/Virtual Kubelet uses static IP addresses for pods. Consider the following scenario:
- We deliberately set up a pod with the fixed IP address "172.17.0.1".
- Each metric collected from this pod requires a distinct port on the localhost.
- Unfortunately, this approach has a drawback: we lose the advantage of using "pod_ip1:port", "pod_ip2:port", etc., consistently across the entire deployment.
Example
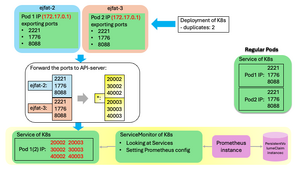
The figure below illustrates a Kubernetes deployment for a user's job with two duplicates:
- Each pod exports ports 2221, 1776, and 8088 for scraping.
- We forward these ports to localhost using SSH tunneling and assign unique ports:
| Remote machine | Remote Port | Local Port |
|---|---|---|
| ejfat-2 | 2221 | 20002 |
| ejfat-2 | 1776 | 30002 |
| ejfat-2 | 8088 | 40002 |
| ejfat-3 | 2221 | 20003 |
| ejfat-3 | 1776 | 30003 |
| ejfat-3 | 8088 | 40003 |
- The service listens to "172.17.0.1:Local Port" as described above. However, since the service treats all pods equally, it reports all the specified ports for every pod.
- Consequently, all metric ports have duplicates within each pod, necessitating direct port checks for differentiation.
Mitigation of the challenge
If a direct connection to the compute nodes from your local machine is possible, you can assign the reachable IP address of the compute node to the VKUBELET_POD_IP environment variable when creating JRM. This can be done using the command export VKUBELET_POD_IP=<compute-ip>, where compute-ip is the IP address of the compute node.
To verify the connection, you can run the command curl http://<compute-ip>:<metrics-port>/metrics from your local machine. Replace compute-ip with the IP address of the compute node and metrics-port with the port number where the metrics are exposed.
