Deploy ERSAP data pipelines at NERSC and ORNL via JIRIAF
Step-by-Step Guide: Using slurm-nersc-ornl Helm Charts
Prerequisites
- Helm 3 installed
- Kubernetes cluster access
- kubectl configured
Overview Flow Chart
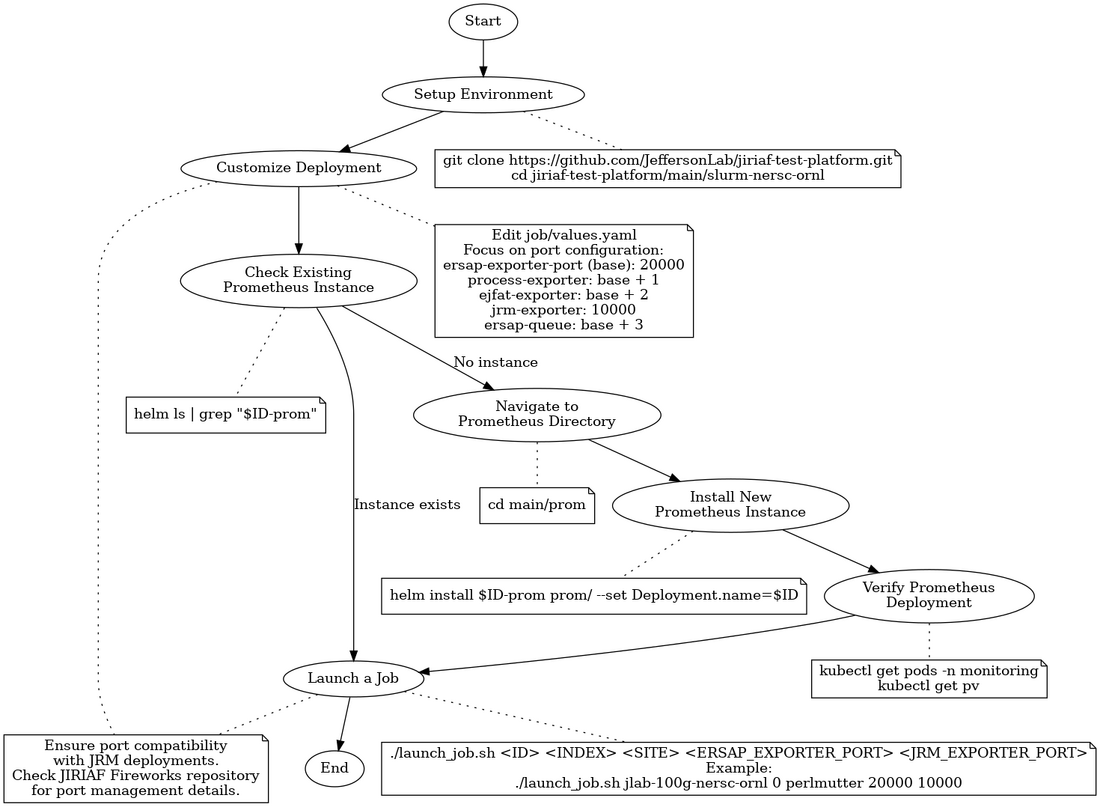
The following flow chart provides a high-level overview of the process for using the slurm-nersc-ornl Helm charts:
This chart illustrates the main steps involved in deploying and managing jobs using the slurm-nersc-ornl Helm charts, from initial setup through job submission.
Step 1: Setup Environment
Clone the repository and navigate to the `slurm-nersc-ornl` folder:
   git clone https://github.com/JeffersonLab/jiriaf-test-platform.git
   cd jiriaf-test-platform/main/slurm-nersc-ornl
Step 2: Customize the Deployment
- Open `job/values.yaml`
- Edit key settings, focusing on port configuration:
   ersap-exporter-port (base): 20000
   │
   ├─ process-exporter: base + 1 = 20001
   │
   ├─ ejfat-exporter:   base + 2 = 20002
   │
   ├─ jrm-exporter:     10000 (exception)
   │
   └─ ersap-queue:      base + 3 = 20003
This structure allows easy scaling and management of port assignments.
Step 3: Deploy Prometheus (If not already running)
- Refer to `main/prom/readme.md` for detailed instructions on installing and configuring Prometheus.
- Check if a Prometheus instance is already running for your project:
helm ls | grep "$ID-prom"
If this command returns no results, it means there's no Prometheus instance for your project ID.
- If needed, install a new Prometheus instance for your project:
cd main/prom
helm install $ID-prom prom/ --set Deployment.name=$ID
- Verify the Prometheus deployment before proceeding to the next step.
Step 4: Launch a Job
Use the `launch_job.sh` script:
- Open a terminal
- Navigate to the chart directory
- Run:
./launch_job.sh <ID> <INDEX> <SITE> <ERSAP_EXPORTER_PORT> <JRM_EXPORTER_PORT>
Example:
./launch_job.sh jlab-100g-nersc-ornl 0 perlmutter 20000 10000
Custom Port Configuration (if needed):
- Edit `launch_job.sh`
- Replace port calculations with desired numbers:
   ERSAP_EXPORTER_PORT=20000
   PROCESS_EXPORTER_PORT=20001
   EJFAT_EXPORTER_PORT=20002
   ERSAP_QUEUE_PORT=20003
- Save and run the script as described above
Step 4: Submit Batch Jobs (Optional)
For multiple jobs:
- Use `batch-job-submission.sh`:
./batch-job-submission.sh <TOTAL_NUMBER>
- Script parameters:
  * `ID`: Base job identifier (default: "jlab-100g-nersc-ornl")
  * `SITE`: Deployment site ("perlmutter" or "ornl", default: "perlmutter")
  * `ERSAP_EXPORTER_PORT_BASE`: Base ERSAP exporter port (default: 20000)
  * `JRM_EXPORTER_PORT_BASE`: Base JRM exporter port (default: 10000)
  * `TOTAL_NUMBER`: Total jobs to submit (passed as argument)
Note: Ensure port compatibility with JRM deployments. Check the JIRIAF Fireworks repository for details on port management.
Understand Key Templates
Familiarize yourself with:
- `job-job.yaml`: Defines Kubernetes Job
- `job-configmap.yaml`: Contains job container scripts
- `job-service.yaml`: Exposes job as Kubernetes Service
- `prom-servicemonitor.yaml`: Sets up Prometheus monitoring
Site-Specific Configurations
The charts support Perlmutter and ORNL sites. Check `job-configmap.yaml`:
    {{- if eq .Values.Deployment.site "perlmutter" }}
        shifter --image=gurjyan/ersap:v0.1 -- /ersap/run-pipeline.sh
    {{- else }}
        export PR_HOST=$(hostname -I | awk '{print $2}')
        apptainer run ~/ersap_v0.1.sif -- /ersap/run-pipeline.sh
    {{- end }}
Monitoring
The charts set up Prometheus monitoring. The [`prom-servicemonitor.yaml`](main/slurm-nersc-ornl/job/templates/prom-servicemonitor.yaml) file defines how Prometheus should scrape metrics from your jobs.
Check and Delete Deployed Jobs
To check the jobs that are deployed, use:
helm ls
To delete a deployed job, use:
helm uninstall $ID-job-$SITE-<number>
Replace `$ID-job-$SITE-<number>` with the name used during installation (e.g., `$ID-job-$SITE-<number>`).
Troubleshooting
- Check pod status: `kubectl get pods`
- View pod logs: `kubectl logs <pod-name>`
- Describe a pod: `kubectl describe pod <pod-name>`
This documentation provides a high-level overview of how to use and customize the Helm charts in the slurm-nersc-ornl folder. For more detailed information about specific components, refer to the individual files linked in this document.
